> ## Documentation Index
> Fetch the complete documentation index at: https://docs.gumstack.com/llms.txt
> Use this file to discover all available pages before exploring further.
# Activity & Analytics
> Monitor tool usage, view call history, and track trends across your organization
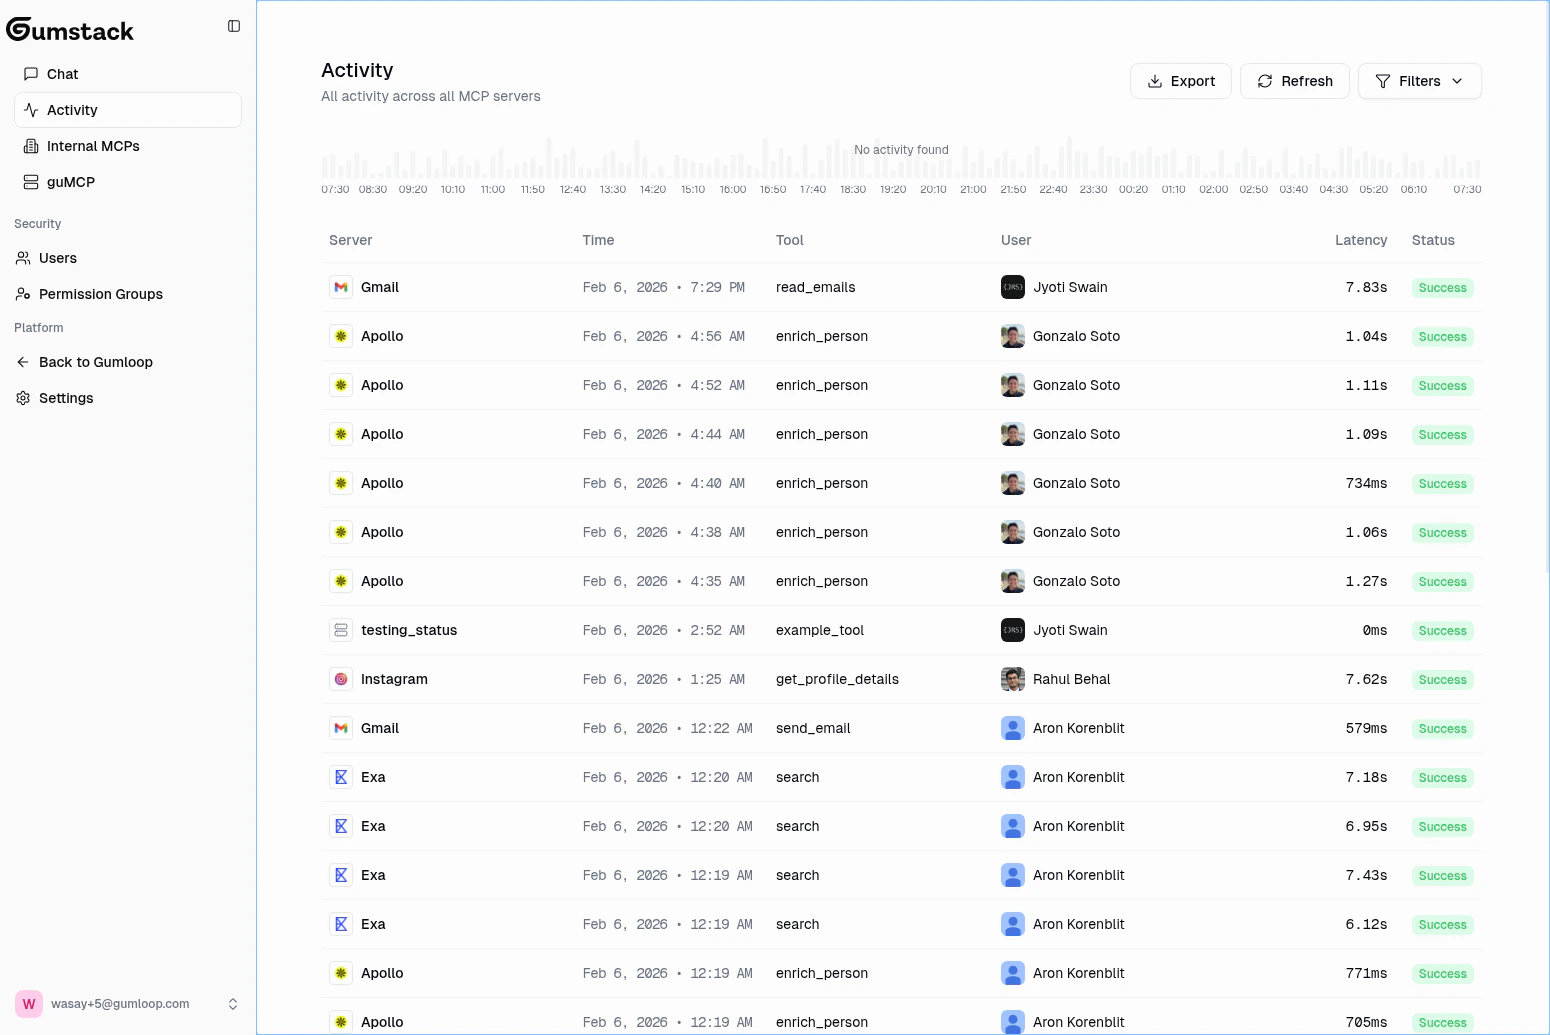
The Activity page gives you a real-time view of how MCP tools are being used across your organization. See tool call volume over time, filter by status or server, and drill into individual calls to see their full input and output.
 ## Activity histogram
The top of the page shows a stacked bar chart of tool call volume over time, color-coded by status:
| Status | Color | Description |
| --------------------- | ----- | -------------------------------- |
| **Success** | Green | Tool call completed successfully |
| **Error** | Red | Tool call failed with an error |
| **Permission Denied** | Amber | Call blocked by access control |
| **In Progress** | Blue | Tool call currently executing |
Hover over any bar to see the exact time range and status breakdown. The histogram is visible when viewing a date range of **24 hours or less**.
## Activity table
The table below the histogram lists every tool call with the following columns:
| Column | Description |
| ----------- | -------------------------------------------------------------------------- |
| **Server** | Server icon and name (clickable). guMCP servers are labeled with "(gumCP)" |
| **Time** | Relative timestamp (e.g., "2 min ago") |
| **Tool** | The specific tool that was invoked |
| **User** | Avatar and display name |
| **Latency** | Response time in milliseconds |
| **Status** | Color-coded badge: Success, Error, Permission Denied, In Progress |
Pagination is 30 items per page (server-side).
## Expanded row details
Click any row to expand it and see the **full input and output** of the tool call.
## Activity histogram
The top of the page shows a stacked bar chart of tool call volume over time, color-coded by status:
| Status | Color | Description |
| --------------------- | ----- | -------------------------------- |
| **Success** | Green | Tool call completed successfully |
| **Error** | Red | Tool call failed with an error |
| **Permission Denied** | Amber | Call blocked by access control |
| **In Progress** | Blue | Tool call currently executing |
Hover over any bar to see the exact time range and status breakdown. The histogram is visible when viewing a date range of **24 hours or less**.
## Activity table
The table below the histogram lists every tool call with the following columns:
| Column | Description |
| ----------- | -------------------------------------------------------------------------- |
| **Server** | Server icon and name (clickable). guMCP servers are labeled with "(gumCP)" |
| **Time** | Relative timestamp (e.g., "2 min ago") |
| **Tool** | The specific tool that was invoked |
| **User** | Avatar and display name |
| **Latency** | Response time in milliseconds |
| **Status** | Color-coded badge: Success, Error, Permission Denied, In Progress |
Pagination is 30 items per page (server-side).
## Expanded row details
Click any row to expand it and see the **full input and output** of the tool call.
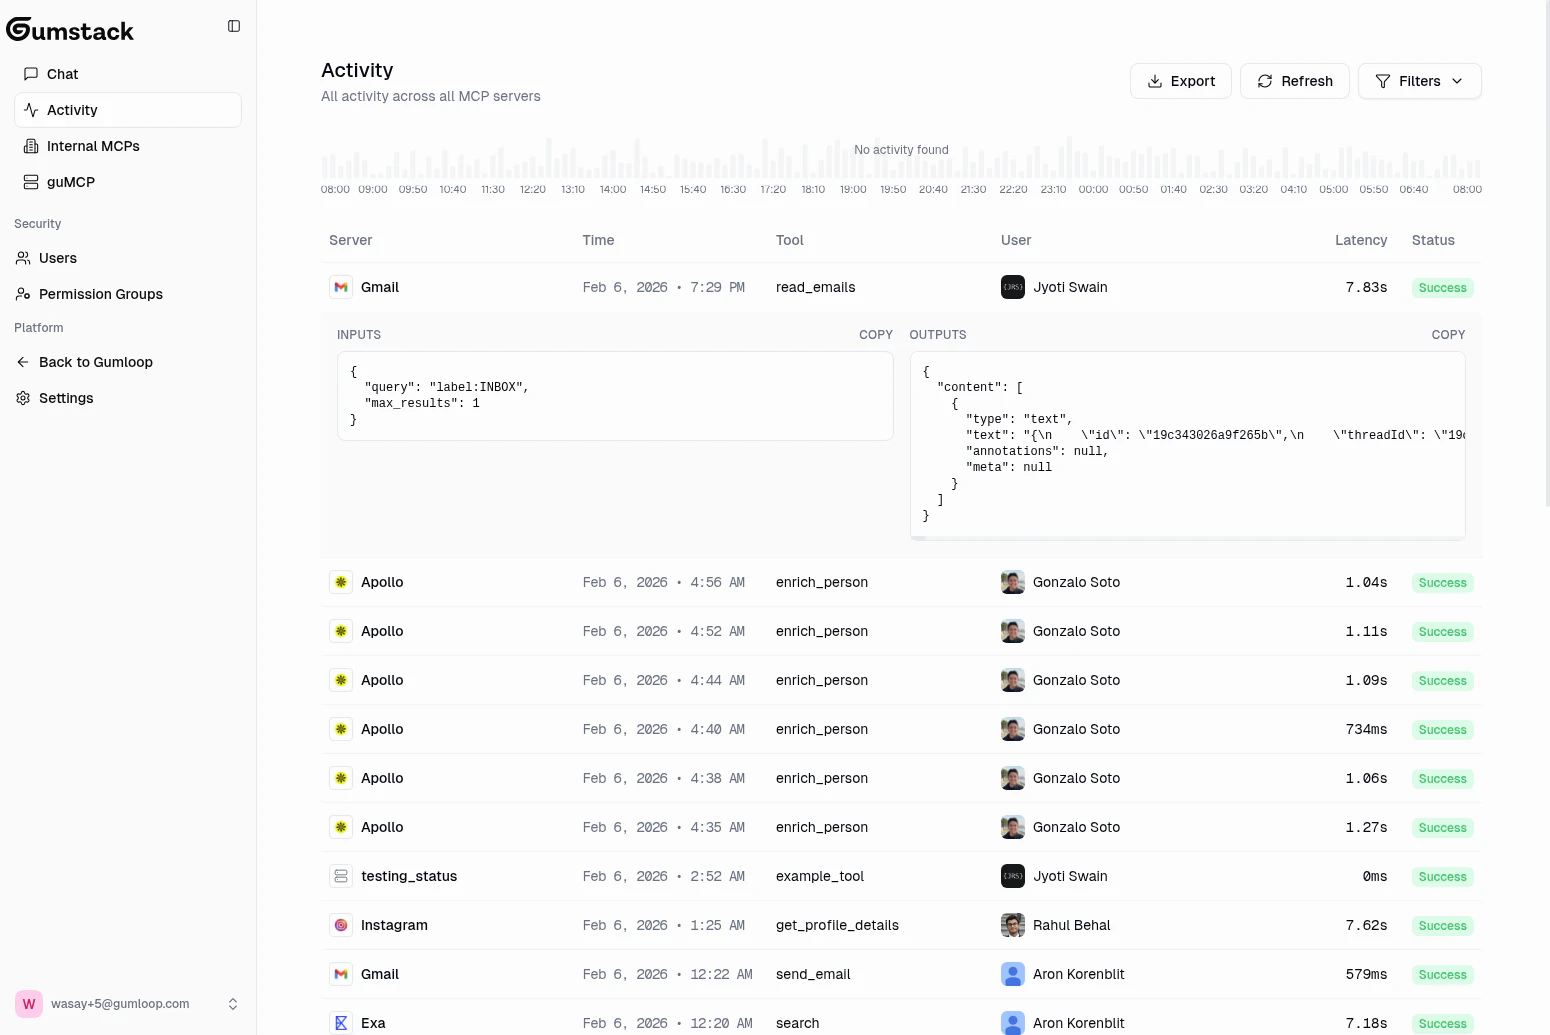 * **Inputs** (left panel): The complete parameters passed to the tool, displayed as formatted JSON with a **Copy** button
* **Outputs** (right panel): The complete response returned by the tool, also formatted JSON with a **Copy** button
* **Error details**: If the call failed, the output panel shows the error in a red-highlighted box
Use expanded row details to debug integration issues. If a tool is returning unexpected results, you can see the exact input that triggered the response.
## Filtering
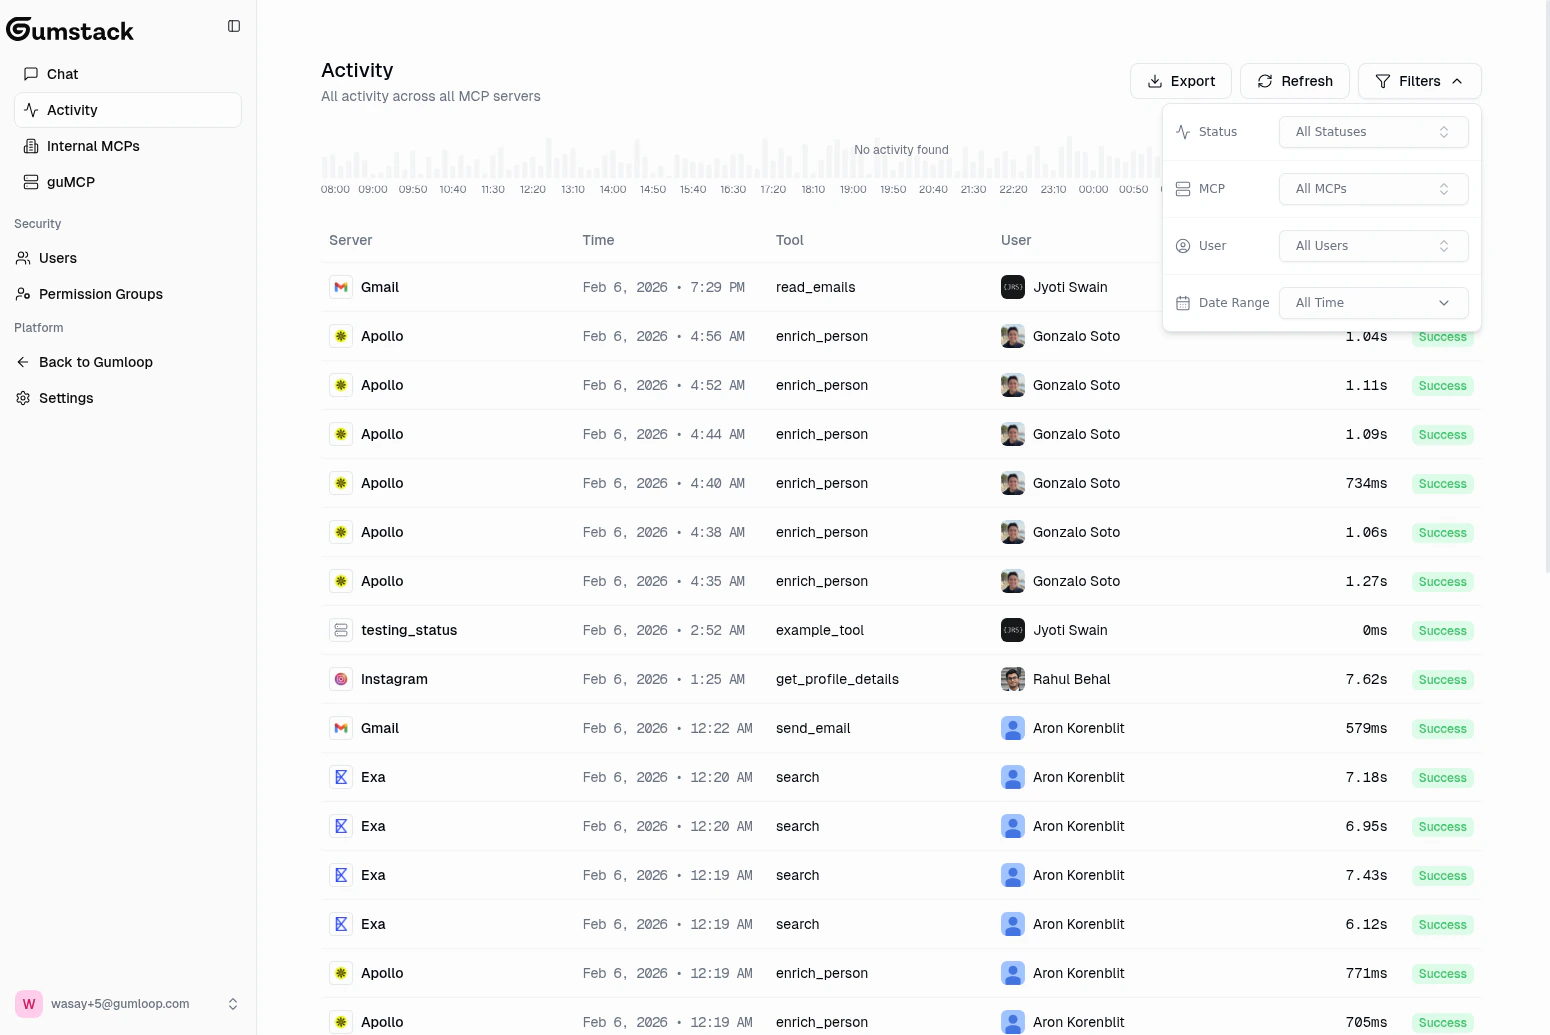
Click the **Filters** button to open the filter popover. The button shows a badge with the count of active filters.
* **Inputs** (left panel): The complete parameters passed to the tool, displayed as formatted JSON with a **Copy** button
* **Outputs** (right panel): The complete response returned by the tool, also formatted JSON with a **Copy** button
* **Error details**: If the call failed, the output panel shows the error in a red-highlighted box
Use expanded row details to debug integration issues. If a tool is returning unexpected results, you can see the exact input that triggered the response.
## Filtering
Click the **Filters** button to open the filter popover. The button shows a badge with the count of active filters.
 | Filter | Description |
| -------------- | ---------------------------------------------------------------------- |
| **Status** | Filter by outcome: All, Success, Error, Permission Denied, In Progress |
| **MCP Server** | Filter to a specific server (guMCP servers labeled with "(gumCP)") |
| **Tool** | Filter to a specific tool |
| **User** | Filter to a specific user's calls (with avatars) |
| **Date Range** | Calendar picker with time support and quick-select presets |
Click **Clear Filters** to reset all filters at once. Changing any filter resets pagination to page 1.
## Export to CSV
Click the **Export** button to download the current view as a CSV file. The export includes: Status, Time (ISO format), Tool, User, Latency (ms), Latency Percentile, and Error. Filename follows the pattern `activity-{date}.csv`.
## Per-server and per-user activity
The same activity interface appears in two other places, scoped to specific contexts:
Found on the [Internal servers](/platform/internal-servers) Activity tab. Includes stat cards at the top (Total Calls, Unique Users, Error Rate, Avg Latency), a Tool filter instead of Server filter, and latency percentile color indicators. Paginated at 10 items per page.
Found on the [Users](/platform/users) detail page. Shows all tool calls for a specific user across every server. CSV export is named `{user-name}-activity-{date}.csv`. Paginated at 10 items per page.
## Related docs
View per-server activity and tool details
View per-user activity history
Understand permission denied entries
Ask the AI about activity trends
| Filter | Description |
| -------------- | ---------------------------------------------------------------------- |
| **Status** | Filter by outcome: All, Success, Error, Permission Denied, In Progress |
| **MCP Server** | Filter to a specific server (guMCP servers labeled with "(gumCP)") |
| **Tool** | Filter to a specific tool |
| **User** | Filter to a specific user's calls (with avatars) |
| **Date Range** | Calendar picker with time support and quick-select presets |
Click **Clear Filters** to reset all filters at once. Changing any filter resets pagination to page 1.
## Export to CSV
Click the **Export** button to download the current view as a CSV file. The export includes: Status, Time (ISO format), Tool, User, Latency (ms), Latency Percentile, and Error. Filename follows the pattern `activity-{date}.csv`.
## Per-server and per-user activity
The same activity interface appears in two other places, scoped to specific contexts:
Found on the [Internal servers](/platform/internal-servers) Activity tab. Includes stat cards at the top (Total Calls, Unique Users, Error Rate, Avg Latency), a Tool filter instead of Server filter, and latency percentile color indicators. Paginated at 10 items per page.
Found on the [Users](/platform/users) detail page. Shows all tool calls for a specific user across every server. CSV export is named `{user-name}-activity-{date}.csv`. Paginated at 10 items per page.
## Related docs
View per-server activity and tool details
View per-user activity history
Understand permission denied entries
Ask the AI about activity trends